* Noise and Ray Marching
[[https://literatelb.org][LiterateLB's]] volumetric visualization functionality relies on a simple ray marching implementation
to sample both the 3D textures produced by the simulation side of things and the signed distance
functions that describe the obstacle geometry. While this produces surprisingly [[https://www.youtube.com/watch?v=n86GfhhL7sA][nice looking]]
results in many cases, some artifacts of the visualization algorithm are visible depending on the
viewport and sample gradients. Extending the ray marching code to utilize a noise function is
one possibility of mitigating such issues that I want to explore in this article.
While my [[https://www.youtube.com/watch?v=J2al5tV14M8][original foray]] into just in time visualization of Lattice Boltzmann based simulations
was only an aftertought to [[https://tree.kummerlaender.eu/projects/symlbm_playground/][playing around]] with [[https://sympy.org][SymPy]] based code generation approaches I have
since put some work into a more fully fledged code. The resulting [[https://literatelb.org][LiterateLB]] code combines
symbolic generation of optimized CUDA kernels and functionality for just in time fluid flow
visualization into a single /literate/ [[http://code.kummerlaender.eu/LiterateLB/tree/lbm.org][document]].
For all fortunate users of the [[https://nixos.org][Nix]] package manager, tangling and building this from the [[https://orgmode.org][Org]]
document is as easy as executing the following commands on a CUDA-enabled NixOS host.
#+BEGIN_SRC sh
git clone https://code.kummerlaender.eu/LiterateLB
nix-build
./result/bin/nozzle
#+END_SRC
** Image Synthesis
Let $C$ be the sample density along a ray $r$ with length $L$ and given an absorption $\mu$. Then
\[ C(r) = \int_0^L c(x) \mu(x) \exp\left(-\int_0^x \mu(t) dt\right) dx \]
is the volume rendering equation yielding per-pixel density values that are easily mapped to
some convenient color palette.
#+BEGIN_EXPORT html
#+END_EXPORT
I.e. we integrate over the values $c(x)$ along the ray weighted by the current absorption $\mu$
and the accumulated absorption up to the current point. This way samples that are closer to
the view origin will be more prominent than samples of the same magnitude that are farther
away which of course is also a rough approximation of how a real volume behaves, hence
the name.
In practice this integral is approximated by the sum
$$C(r) = \sum_{i=0}^N c(i \Delta x) \alpha (i \Delta x) \prod_{j=0}^{i-1} \left(1 - \alpha(j\Delta x)\right)$$
for step width \(\Delta x \in \mathbb{R}^+\) in the most basic case.
This approach may be extended arbitrarily, e.g. it is only a couple of phase functions
away from being able [[https://tree.kummerlaender.eu/projects/firmament/][recover the color produced by light travelling through the participating media that is our atmosphere]].
** The Problem
There are many different possibilities for the choice of samples \(c(x)\) in the volume rendering
equation. E.g. velocity and curl norms, the scalar product of ray direction and shear layer
normals or vortex identifiers such as the Q criterion
\[ Q = \|\Omega\|^2 - \|S\|^2 > 0 \text{ commonly thresholded to recover isosurfaces} \]
that contrasts the local vorticity and strain rate norms. The strain rate tensor \(S\) is easily
recovered from the non-equilibrium populations \(f^\text{neq}\) of the simulation lattice — and is in
fact already used for the turbulence model. Similarly, the vorticity \(\Omega = \nabla \times u\) can be
computed from the velocity field using a finite difference stencil.
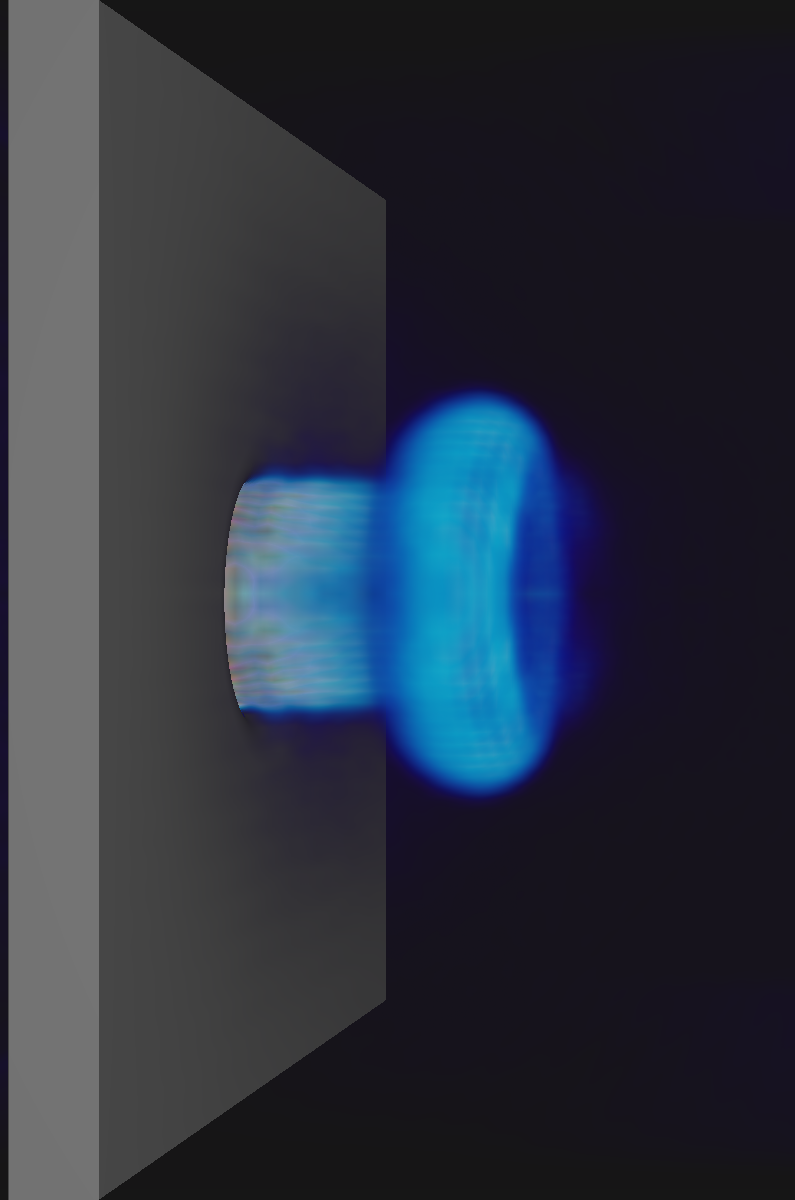
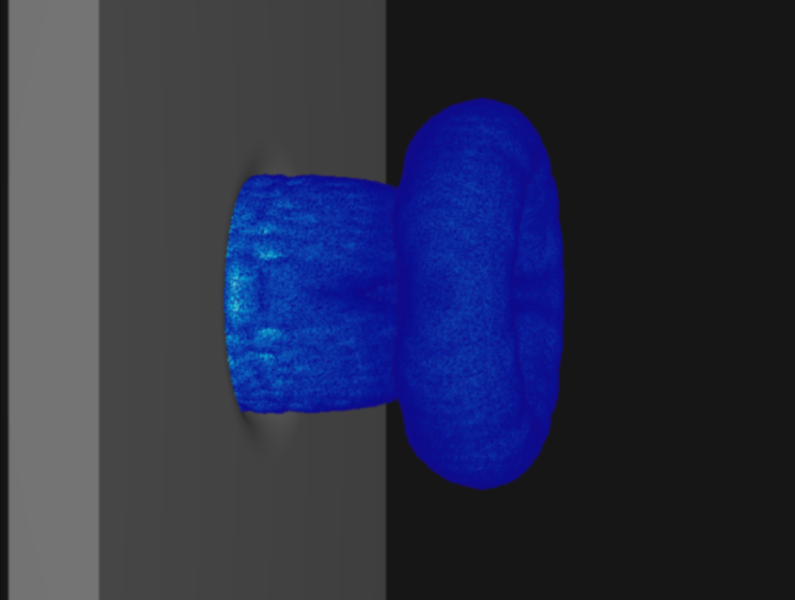
The problem w.r.t. rendering when thresholding sampling values to highlight structures in the flow
becomes apparent in the following picture:
#+BEGIN_EXPORT html
Q Criterion
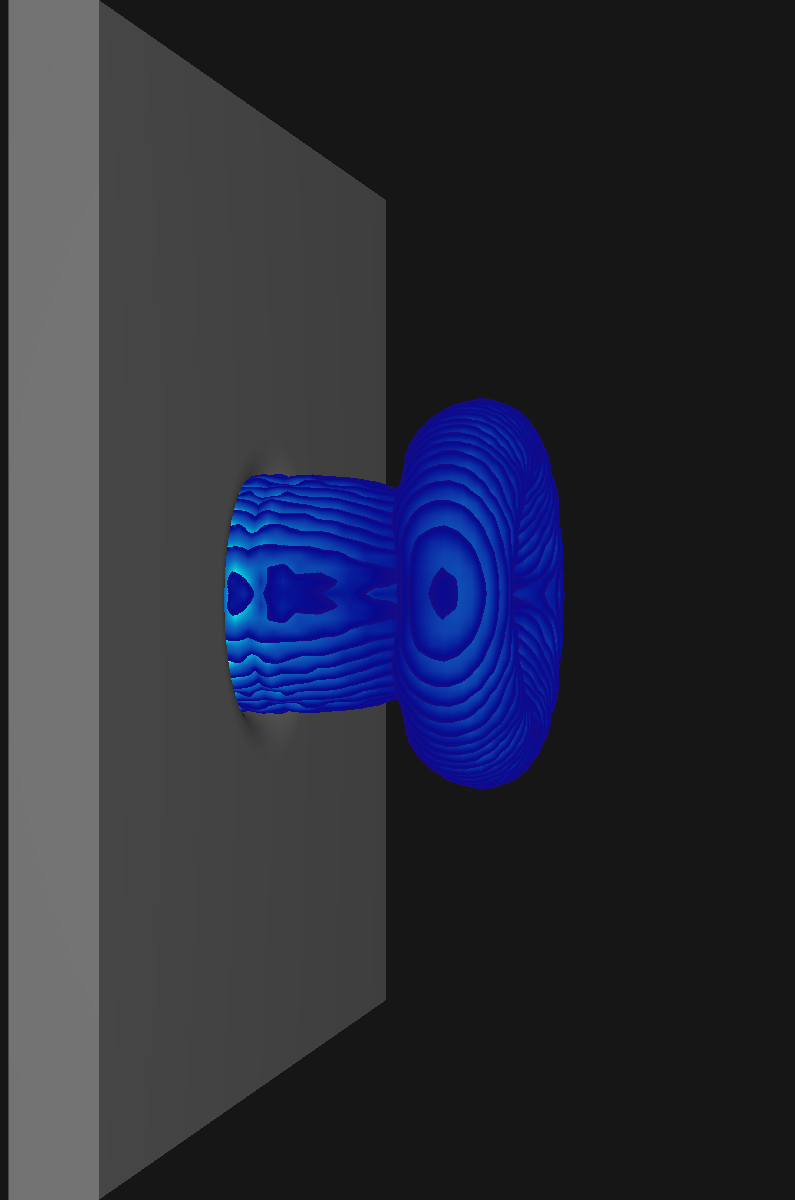
Curl Norm
#+END_EXPORT
While the exact same volume discretization was used for both visualizations, the slices are much
less apparent for the curl norm samples due to the more gradual changes. In general the issue is
most prominent for scalar fields with large gradients (specifically the sudden jumps that occur
when restricting sampling to certain value ranges as is the case for the Q criterion).
** Colors of Noise
Volumetric renderings that are produced when using a plain ray marching algorithm may contain
undesired artifacts. Specifically the choice of start offsets w.r.t. to the view origin can lead
to slicing artifacts. While this tends to become less noticable for smaller step widths these are
not desirable from a performance perspective.
What I settled on for LiterateLB's renderer are view-aligned slicing and random jittering to remove
most visible artifacts. The choice of /randomness/ for jittering the ray origin is critical here as plain
random numbers produce a distracting static-like pattern. A common choice in practice is to use so
called /blue noise/ instead. Noise is called /blue/ if it contains only higher frequency components which
makes it harder for the pattern recognizer that we call brain to find patterns where there should be
none.
The [[https://www.spiedigitallibrary.org/conference-proceedings-of-spie/1913/0000/Void-and-cluster-method-for-dither-array-generation/10.1117/12.152707.short?SSO=1][void-and-cluster algorithm (doi:10.1117/12.152707)]] provides a straight forward method for
pre-computing tileable blue noise textures to be reused during the visualization.
The first ingredient for this algorithm is a =filteredPattern= function that applies a
plain Gaussian filter with given $\sigma$ to a cyclic 2d array. Using cyclic wrapping here is
what renders the generated texture tileable.
#+BEGIN_SRC python
def filteredPattern(pattern, sigma):
return gaussian_filter(pattern.astype(float), sigma=sigma, mode='wrap', truncate=np.max(pattern.shape))
#+END_SRC
This function will be used to compute the locations of the largest void and tightest
cluster in a binary pattern (i.e. a 2D array of 0s and 1s). In this context a /void/ describes
an area with only zeros and a /cluster/ describes an area with only ones.
#+BEGIN_SRC python
def largestVoidIndex(pattern, sigma):
return np.argmin(masked_array(filteredPattern(pattern, sigma), mask=pattern))
#+END_SRC
These two functions work by considering the given binary pattern as a float array that is blurred by
the Gaussian filter. The blurred pattern gives an implicit ordering of the /voidness/ of each pixel, the
minimum of which we can determine by a simple search. It is important to exclude the initial binary
pattern here as void-and-cluster depends on finding the largest areas where no pixel is set.
#+BEGIN_SRC python
def tightestClusterIndex(pattern, sigma):
return np.argmax(masked_array(filteredPattern(pattern, sigma), mask=np.logical_not(pattern)))
#+END_SRC
Computing the tightest cluster works in the same way with the exception of searching the largest array
element and masking by the inverted pattern.
#+BEGIN_SRC python
def initialPattern(shape, n_start, sigma):
initial_pattern = np.zeros(shape, dtype=np.bool)
initial_pattern.flat[0:n_start] = True
initial_pattern.flat = np.random.permutation(initial_pattern.flat)
cluster_idx, void_idx = -2, -1
while cluster_idx != void_idx:
cluster_idx = tightestClusterIndex(initial_pattern, sigma)
initial_pattern.flat[cluster_idx] = False
void_idx = largestVoidIndex(initial_pattern, sigma)
initial_pattern.flat[void_idx] = True
return initial_pattern
#+END_SRC
For the initial binary pattern we set =n_start= random locations to one and then repeatedly
break up the largest void by setting its center to one. This is also done for the tightest cluster
by setting its center to zero. We do this until the locations of the tightest cluster and largest
void overlap.
#+BEGIN_SRC python
def blueNoise(shape, sigma):
n = np.prod(shape)
n_start = int(n / 10)
initial_pattern = initialPattern(shape, n_start, sigma)
noise = np.zeros(shape)
pattern = np.copy(initial_pattern)
for rank in range(n_start,-1,-1):
cluster_idx = tightestClusterIndex(pattern, sigma)
pattern.flat[cluster_idx] = False
noise.flat[cluster_idx] = rank
pattern = np.copy(initial_pattern)
for rank in range(n_start,int((n+1)/2)):
void_idx = largestVoidIndex(pattern, sigma)
pattern.flat[void_idx] = True
noise.flat[void_idx] = rank
for rank in range(int((n+1)/2),n):
cluster_idx = tightestClusterIndex(np.logical_not(pattern), sigma)
pattern.flat[cluster_idx] = True
noise.flat[cluster_idx] = rank
return noise / (n-1)
#+END_SRC
The actual algorithm utilizes these three helper functions in four steps:
1. Initial pattern generation
2. Eliminiation of =n_start= tightest clusters
3. Elimination of =n/2-n_start= largest voids
4. Elimination of =n-n/2= tightest clusters of inverse pattern
For each elimination the current =rank= is stored in the noise texture
producing a 2D arrangement of the integers from 0 to =n=. As the last
step the array is divided by =n-1= to yield a grayscale texture with values
in $[0,1]$.
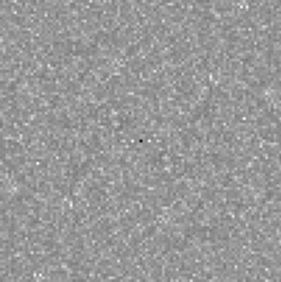
In order to check whether this actually generated blue noise we can take a
look at the Fourier transformation for an exemplary \(100 \times 100\) texture:
#+BEGIN_EXPORT html
Blue noise texture
Fourier transformation
#+END_EXPORT
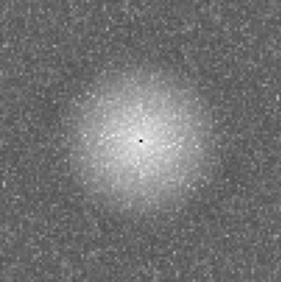
One can see clearly that higher frequency components are significantly more prominent
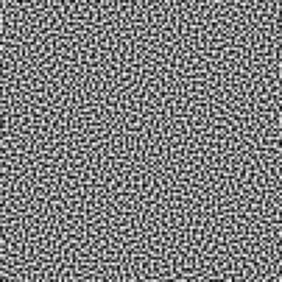
than lower ones. Contrasting this to white noise generated using uniformly distributed
random numbers, no preference for any range of frequencies can be observed:
#+BEGIN_EXPORT html
White noise texture
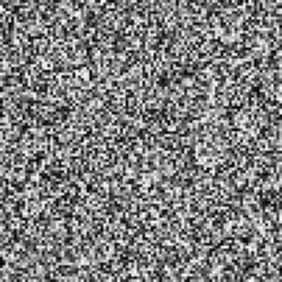
Fourier transformation
#+END_EXPORT
** Comparison
Contasting the original Q criterion visualization to one produced using blue noise jittering
followed by a soft blurring shader, we can see that the slicing artifacts mostly vanish.
While the jittering is apparent if one looks closely, the result is more visually pleasing
also arguably more faithful to the underlying scalar field.
#+BEGIN_EXPORT html
Simple ray marching
Ray marching with blue noise jittering
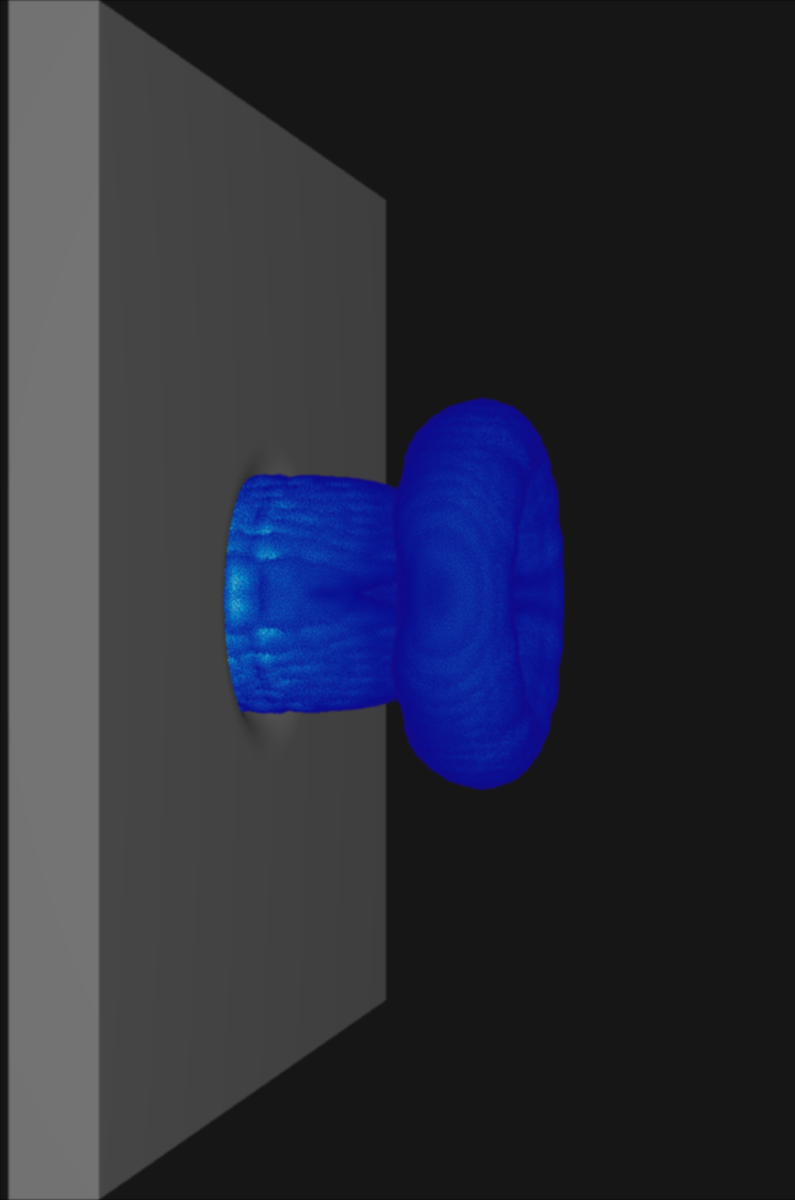
#+END_EXPORT
While white noise also obcures the slices the additional lower frequency components
produce a more obvious pattern in the resulting image compared to blue noise.
#+BEGIN_EXPORT html
Blue noise
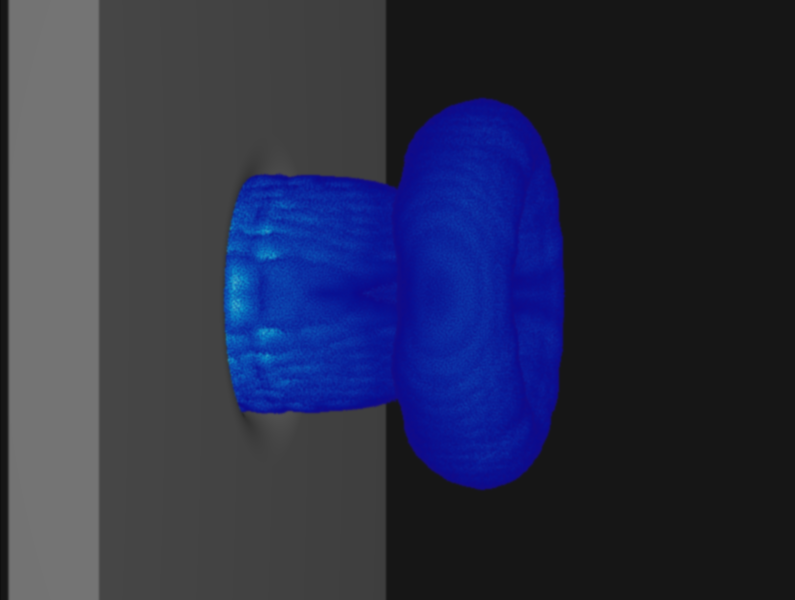
White noise
#+END_EXPORT
#+BEGIN_EXPORT html
#+END_EXPORT