
diff options
Converted image tags into Kramdown syntax
* there is no reason for embedding raw XHTML if we are able to generate the same in pure Kramdown
** this increases separation between content and presentation
** it will be easier to e.g. replace XHTML output with HTML5 in the future
Diffstat (limited to 'source/00_content/articles/2011-06-14_darstellen_von_gps_daten_mit_gnuplot.md')
| -rw-r--r-- | source/00_content/articles/2011-06-14_darstellen_von_gps_daten_mit_gnuplot.md | 4 |
1 files changed, 2 insertions, 2 deletions
diff --git a/source/00_content/articles/2011-06-14_darstellen_von_gps_daten_mit_gnuplot.md b/source/00_content/articles/2011-06-14_darstellen_von_gps_daten_mit_gnuplot.md index 7fe2f24..2d39f1c 100644 --- a/source/00_content/articles/2011-06-14_darstellen_von_gps_daten_mit_gnuplot.md +++ b/source/00_content/articles/2011-06-14_darstellen_von_gps_daten_mit_gnuplot.md @@ -71,7 +71,7 @@ def printCsv(gpxPositions): ## Plotten mit gnuplot -<img src="http://static.kummerlaender.eu/media/gnuplot_gpx.jpg" alt="Gnuplot output" class="clear full"/> +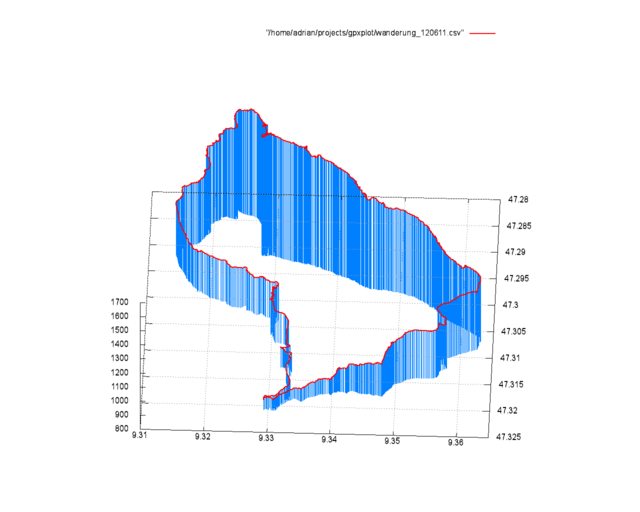{: .full .clear} Eine solche, dreidimensionale Ausgabe der GPS Daten zu erzeugen ist mit der `splot`-Funktion sehr einfach. @@ -102,4 +102,4 @@ Falls jemand den Artikel mit meinen Daten nachvollziehen möchte - das GPX-File Zum Schluss hier noch ein Blick vom Weg auf den Kronberg Richtung Jakobsbad im Appenzell: -<img src="http://static.kummerlaender.eu/media/kronberg.jpg" alt="Aussicht auf Jakobsbad im Appenzell" class="full"/> +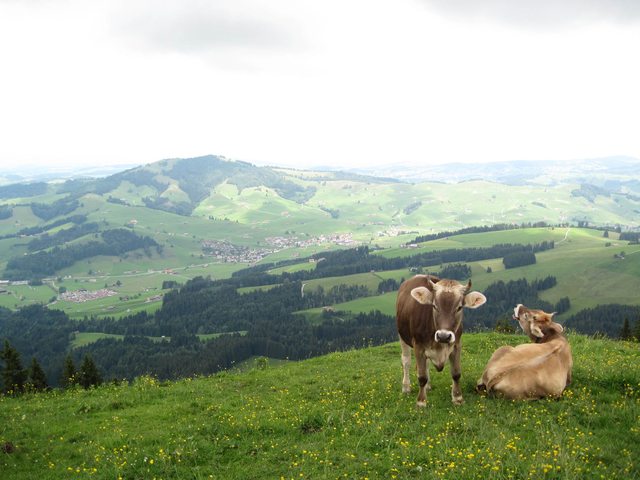{: .full} |